

Short answer: You measure generative engine optimization by tracking a fixed set of buyer questions across ChatGPT, Perplexity, Gemini, Claude and Google’s AI features, repeatedly, and reporting how often you appear, where you rank in the answer, how often your site is cited, and how that compares with competitors. Website analytics adds a useful but partial signal, because much AI-driven traffic is never attributed to AI.
“Are we showing up in ChatGPT?” is the question every marketing leader is now asked, and most can only answer with a screenshot. A screenshot proves almost nothing: ask the same question twice and you can get a different answer. To manage GEO like any other channel, you need metrics that are repeatable, comparable over time, and benchmarked against competitors.
This guide covers the KPIs that matter, how to collect them, and what real tracking data looks like, using anonymized screenshots from InfluenceLayer, the AI visibility platform we built and use with clients.
Why GEO is hard to measure
Three things make AI visibility different from search rankings:
- There is no rank tracker. Google has positions 1 to 10. An AI answer is a paragraph that may name three brands, cite five sources, or neither.
- Answers vary. The same prompt can produce different answers from run to run, from engine to engine, and from week to week. You need a share across many runs, not a single result.
- Analytics undercounts it. Many people read the AI answer and never click. Of those who do, many arrive without a referrer and land in Direct traffic. Google reports AI Overviews and AI Mode clicks inside normal web search totals in Search Console, with no separate filter.
So the core of GEO measurement happens at the prompt level: what AI engines say when your buyers ask, before anyone clicks.
Step 1: Build a prompt set
Your prompt set is the GEO equivalent of a keyword list. Include:
- Category questions: “best [category] for [use case]”, “top [category] companies”.
- Problem questions: the problems your product solves, phrased the way buyers phrase them.
- Comparison questions: “[your brand] vs [competitor]”, “alternatives to [competitor]”.
- Evaluation questions: “what should I look for in a [category] supplier?”
Group them into clusters by product line or market so you can see where you’re strong and where you’re missing. A focused brand usually needs 50 to 150 prompts. Fewer than about 20 and the numbers get noisy.
Step 2: Track the core AI visibility KPIs
These are the metrics we report for every GEO client.
1. Prompt coverage
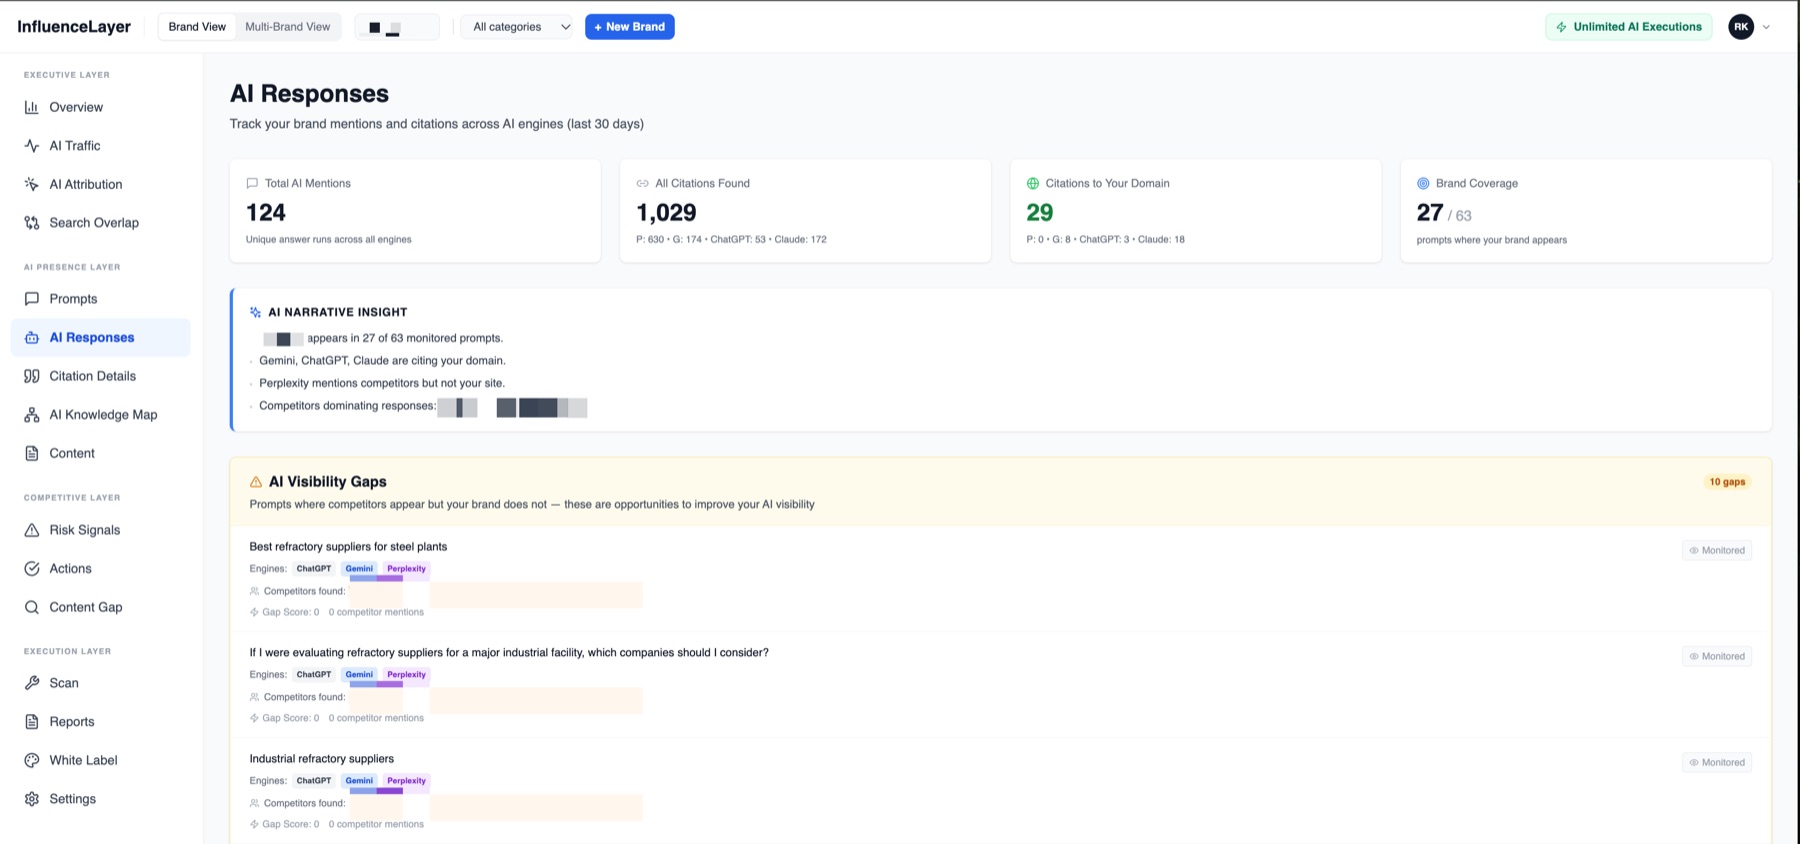
The share of tracked prompts where your brand appears at all. It is the simplest headline number and the first one to move.
2. Share of voice
How often you are mentioned compared with competitors, across the same prompts. Coverage tells you whether you show up; share of voice tells you whether you are winning. In the example above, three competitors dominate responses even though the brand appears in 43% of prompts.
3. First-mention position
Whether you are the first brand named. Buyers often go with the first or only recommendation. A brand that is always mentioned third is visible but not preferred. Track the share of answers where you are named first.
4. Citation rate
How often AI engines link to your own website as a source. Being mentioned and being cited are different things. A mention means the model knows you; a citation means it trusts your content enough to send people to it.
In the dashboard above, the engines produced 1,029 citations across the tracked prompts, and only 29 of them pointed to the brand’s own domain. Competitors are being cited far more often for the same questions.
5. Results per engine
The same KPIs, split by ChatGPT, Perplexity, Gemini, Claude and Copilot. Engines behave very differently, and averages hide it.
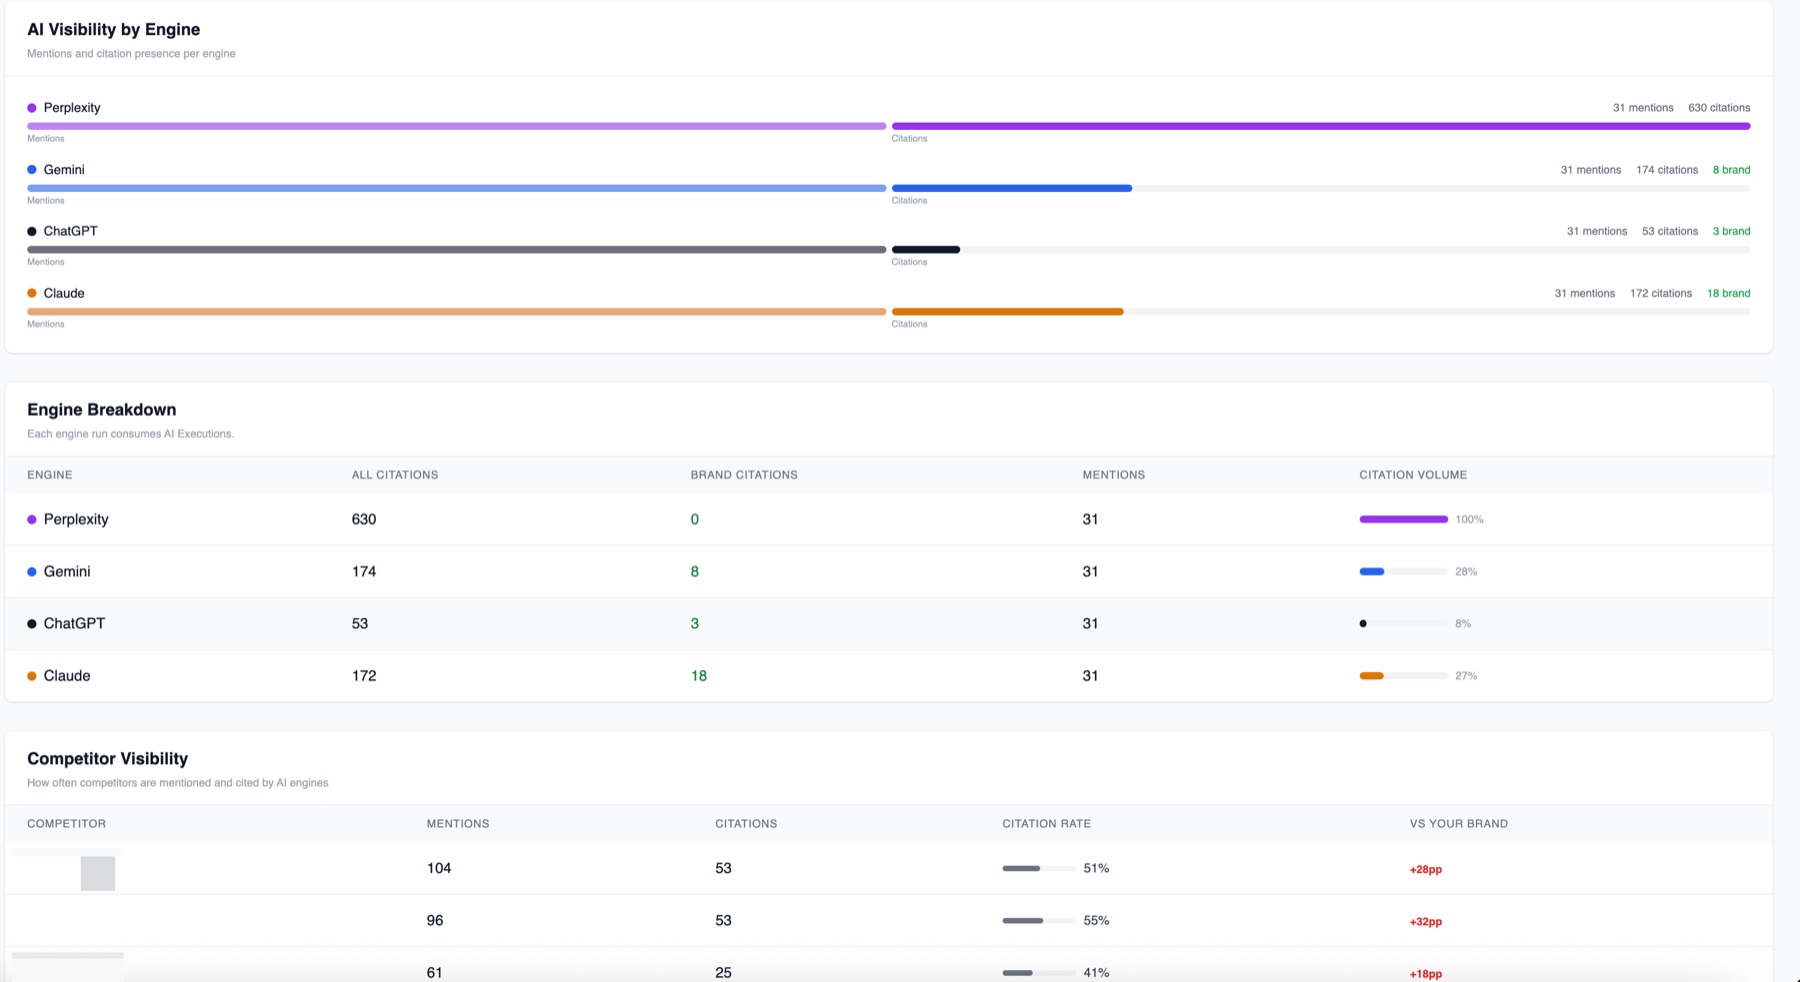
A gap like this is actionable. Perplexity retrieves live from the web, so zero citations usually means the brand’s pages aren’t ranking or aren’t quotable for those questions, which is fixable.
6. Sentiment and accuracy
Whether AI describes you correctly and favorably. Being named with outdated pricing, a wrong headquarters or a competitor’s weakness attributed to you is worse than not being named. Review a sample of answers each month for accuracy, and track the share of mentions that are positive, neutral or negative.
7. Citation alignment
Whether engines cite the page you want them to. Often a brand has a strong page on a topic, but AI engines cite its homepage or a third-party site instead.

When the right page exists but isn’t cited, the fix is usually restructuring it to answer the question directly, plus internal links and external mentions pointing to it. When no good page exists, you need to create one.
8. A composite score, tracked over time
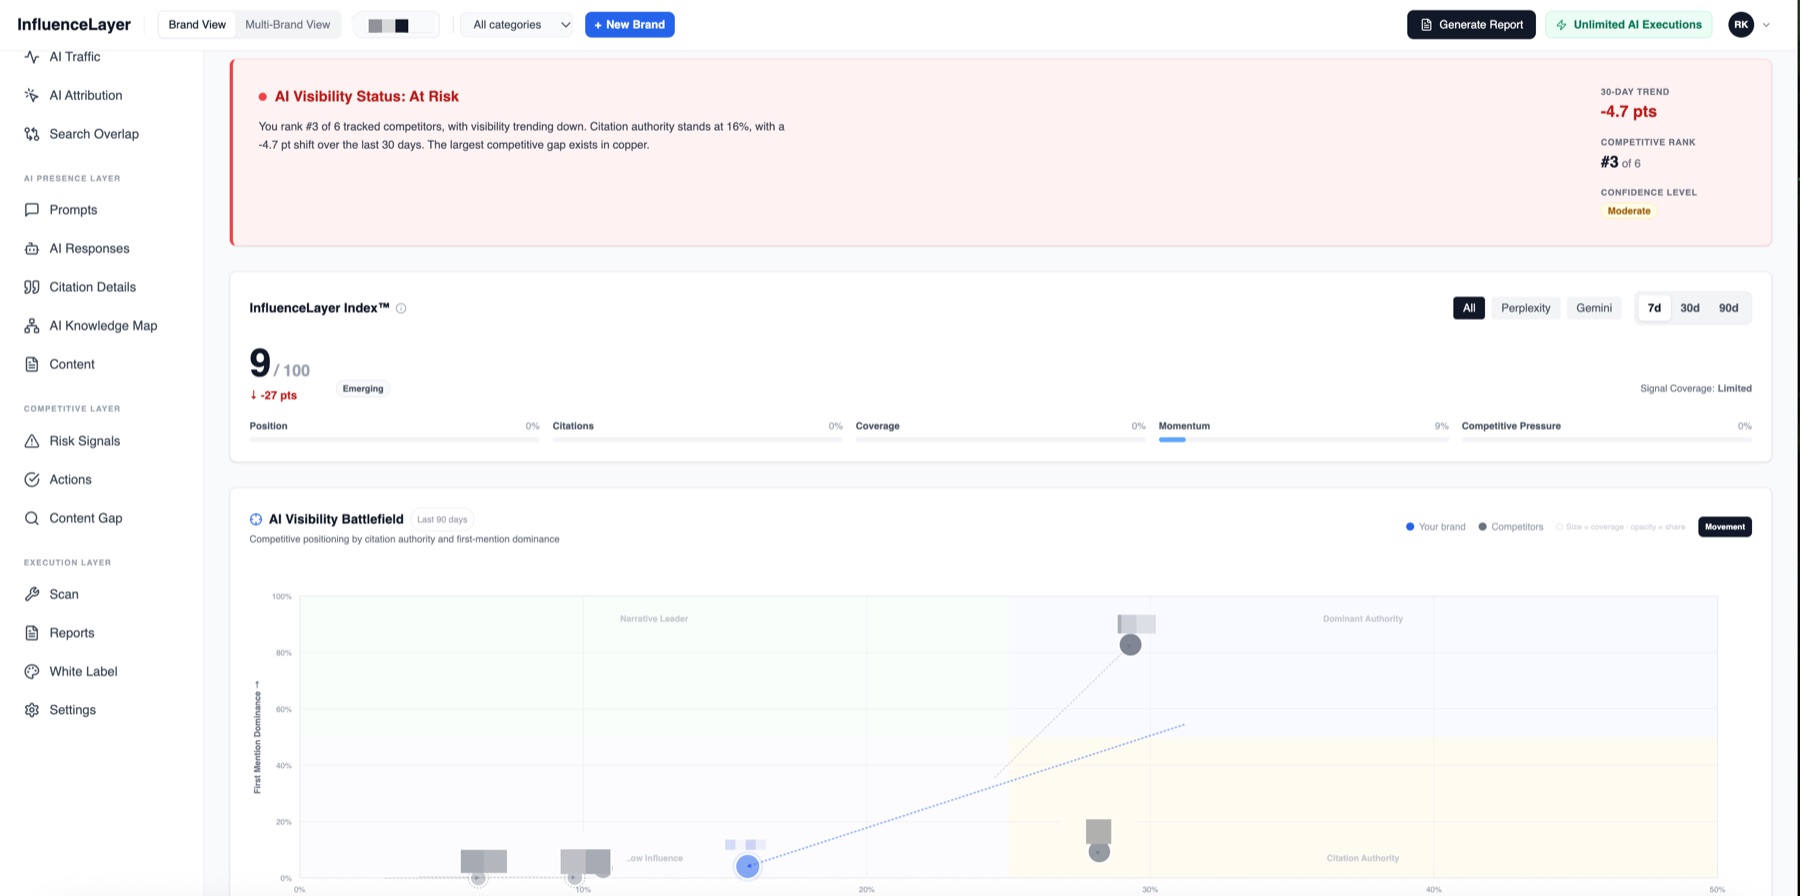
Individual metrics are useful for the work; executives need one number and a trend. We roll position, citations, coverage, momentum and competitive pressure into a single index and show where the brand sits against its competitors.
Step 3: Connect AI visibility to traffic and revenue
Prompt-level KPIs show visibility. You still want to see business results, with realistic expectations:
- Create an AI channel in GA4. Group sessions from sources such as chatgpt.com, perplexity.ai, gemini.google.com, copilot.microsoft.com and claude.ai into a custom “AI assistants” channel group. GA4’s default channels don’t include one.
- Expect undercounting. Many AI clicks arrive without a referrer and are counted as Direct. ChatGPT has at times added
utm_source=chatgpt.comto its links, but reports in October 2026 suggest that tagging has become unreliable. Treat AI referral numbers as a floor, not a total. - Ask how people found you. Add “how did you hear about us?” to your forms and sales calls, with an AI assistant option. It often surfaces AI influence that analytics never sees.
- Watch branded search. When AI engines recommend you, more people search your name. A rise in branded searches alongside rising coverage is a good sign.
Step 4: Turn the numbers into actions
Measurement is only useful if it tells you what to do next. Every gap in the data maps to a specific fix:
| What the data shows | What to do |
|---|---|
| Brand absent on a prompt cluster | Publish or restructure a page that answers those questions directly |
| Mentioned but not cited | Make your pages more quotable: clear answers, numbers, sources |
| Competitor always named first | Create comparison content; win presence on the sources engines cite |
| Weak on one engine only | Check what that engine retrieves; fix ranking and access for those pages |
| Engines cite the wrong page | Strengthen the right page and point internal links and mentions to it |
| Inaccurate descriptions | Correct your company facts everywhere they appear |

How often to measure
- Weekly for active GEO programs: enough runs to see real movement through the noise.
- Monthly at minimum for brands just keeping watch.
- After every major change: a new page, a PR push, or a new model release from one of the engines.
Report trends against your baseline and against competitors, never single runs.
Common measurement mistakes
- Screenshots as evidence. One answer is an anecdote. Measure shares across many runs and prompts.
- Only tracking your brand name. “What do you know about [brand]?” tells you little. Track the questions buyers ask before they know your name.
- Averaging across engines. A strong Claude result can hide a zero on Perplexity.
- Relying on GA4 alone. It misses most AI influence.
- Measuring without acting. The value is in the gap list and the fixes that follow.
Getting started
Write down 20 questions your buyers ask before choosing a vendor, run each through ChatGPT, Perplexity, Gemini and Claude three times, and record who is named, who is first and which sites are cited. That rough baseline will already show you where you stand.
To do it at scale, with weekly tracking across every major engine, competitor benchmarks and a prioritized action list, talk to us about generative engine optimization, or see InfluenceLayer. New to the topic? Start with what is generative engine optimization.